
Macro Deep Dive Report
**Macro Deep Dive – Fed Manufacturing Surveys**
Takeaway:
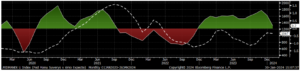
According to FED surveys, manufacturing activity has been in contraction territory since May of 2022. Despite this, the “expectations vs reality” index showed that actual activity was consistently surpassing the 6 month forward looking data. Following a bottom in May of last year topline data was trending higher, and in position to transition into expansion territory.
However, January data stands in sharp contrast to the recent trend. It not only came in in well below economists’ estimates, but also registers at its lowest level since May 2020. These surveys tend to move with the closely watched ISM Manufacturing PMI which will be released on Thursday.
Data:
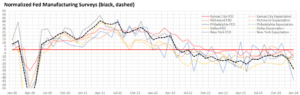
Philadelphia improved slightly to -10.6 from -12.8 in the previous month, though it still fell short of the expected -7. This represents the 18th negative reading in the last 20 months. Notably, both indexes for new orders (from -22.1 to -17.9) and shipments (from -11.2 to -6.2) rose.
NY Empire experienced the most significant decline of the bunch, dropping to its lowest level since May 2020 at -43.7. This is a stark contrast from December’s -14.5 and far below the anticipated improvement to -5. The decline was most marked by new orders (-49.4 vs -11.3) and shipments (-31.3 vs -6.4).
Richmond fell to its lowest since February 2023, reaching -15, down from -11 in December and substantially below the forecasted increase to -8. Particularly, employment experienced the most significant drop, falling to -15 from -1.
Kansas City decreased to -9 from -1 in the prior month, marking the sharpest downturn in the district’s manufacturing activity since July 2023 and came in well below the market expected -3.
Dallas slipped to -27.4 from -10.4, the lowest in eight months. A key factor in this drop was the production index, which plummeted 17 points to -15.4, reaching its lowest level since mid-2020. Similarly, the employment index also hit a low not seen since mid-2020, decreasing 7 points to -9.7.
Normalized Fed Manufacturing Surveys (black, dashed)
Manufacturing – Expectations v. Reality Index (3mo moving average) vs Monthly Spot HRC