

Macro Report
Week’s Takeaway:
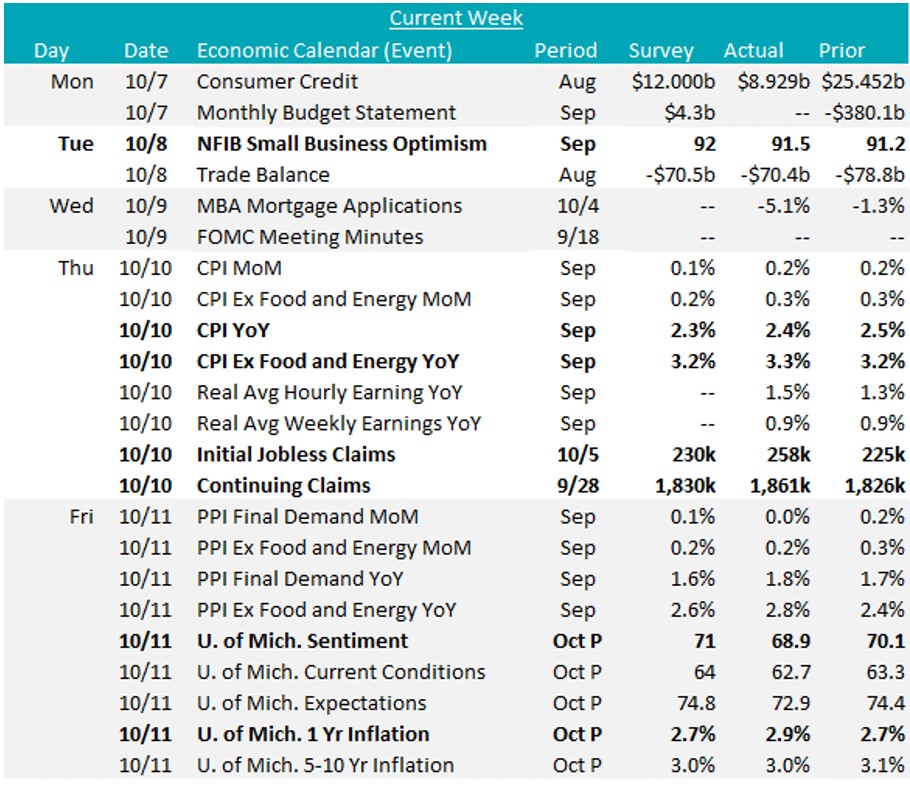
This week’s data was focused on inflation, which was mixed but mostly came in above expectations. In response the market has started to price in a less aggressive cutting cycle.
Notes:
September’s MoM CPI (Consumer Price Index) and Core CPI both came in slightly elevated, up 0.2% versus 0.1% expectations, 0.3% versus 0.2% expectations, respectively. The YoY CPI Core which excludes food & energy rose for the second consecutive month, now up to 3.3% from August’s reading of 3.1%. The clear overarching trend is that disinflation will continue. with current YoY levels 0.8% below where we were in September 2023 (4.1%). However, if recent stickiness in YoY price pressure proves to be more than a blip, will need to reevaluate the pace of the cutting cycle.
Another datapoint to flag came from the University of Michigan Consumer Sentiment Survey. The preliminary topline figure for October came in below expectations of 71 and last months reading of 70.1, moving down to 68.9 but the most applicable signal for the FED was the unexpected rise in 1yr Inflation Expectations up to 2.9% from 2.7% in September. On the other hand, the September Topline MoM PPI (Producer Price Index) was below expectations and unchanged, as energy prices kept the index stable, while Core PPI rose. Overall, price pressure from producers does not currently suggest that there has been much cost push pressure on consumers.
On the demand side, the NFIB Small Business Optimism index rose to 91.5 in September, a tick up from 91.2 in August but below the market expected 92.0. This marks the 33rd consecutive month the index has remained below the 50-year average of 98. Additionally, the Uncertainty Index surged by 11 points to 103, the highest level on record. While the uncertainty component typically surges heading into a presidential election, the “record level” shows the compounded impact of elevated borrowing costs.
Finally, initial jobless claims (258k versus expected 230k) and continuing claims (1,861k versus expected 1,830k) both surged, providing a contradictory signal from the impressive payroll additions from the week prior. However, upon further inspection, this can be almost entirely explained away by Hurricane Helene and the ongoing strike from Boeing and thus the surprise does not signal a fundamental shift in the labor market. We anticipate both of these will be temporarily elevated (especially as the impact of Milton works through the labor market). From a policy perspective, the FOMC will likely look through the surge in claims and potentially lower than expected payrolls number at their next meeting.
Next Week’s Notes:
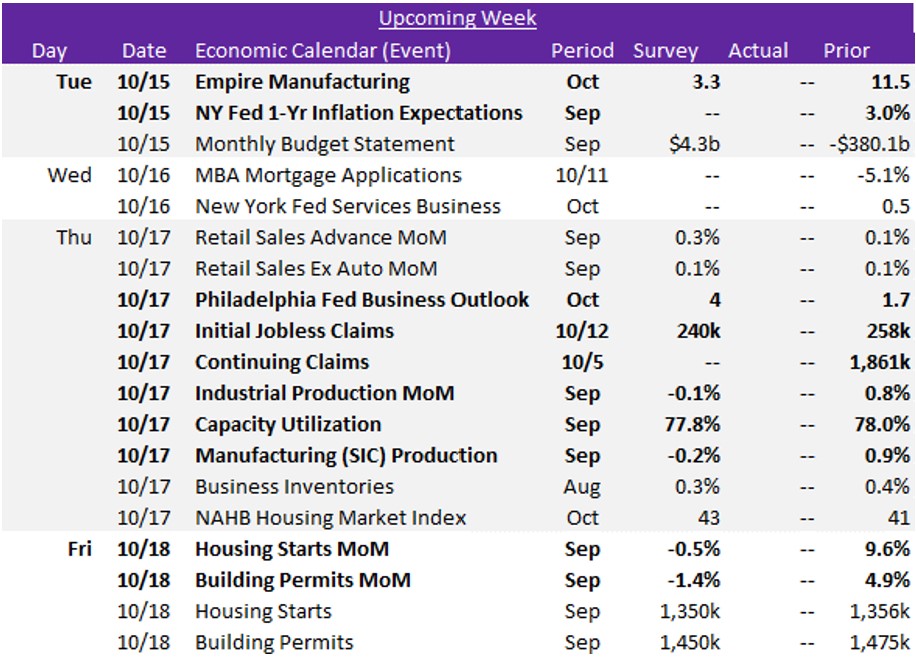
Next week, the first two of five Fed Manufacturing Surveys for October will be released: the NY Empire index, which is expected to decline to 3.3 from 11.5, and the Philadelphia index, anticipated to rise to 4 from September’s 1.7. Additionally, Industrial Production for September is forecasted to decrease by -0.1%, reflecting an expected Capacity Utilization rate of 77.8%, which would be down from the 0.8% increase in August, that operated at a rate of 78.0%. Within this data, we will also see Manufacturing (SIC) Production in September, projected for a -0.2% decline from 0.9% increase in the prior month. These market expectations suggest a continued cautious outlook for the manufacturing sector.
In the upcoming week, housing market data is also set to be reported. Housing Starts in September has forecasts of a -0.5% decline (an annual 1350k) from 9.6% increase (1356k units) in August. Similarly, Building Permits are expected for a downturn, falling by -1.4% (1450k) in September from August’s 4.9% increase (1475k). Furthermore, October’s NAHB Housing Market will be issued, with market expectations of rising further from September’s gain of 41 to 43. While this forecast for October reflects some resilience, a decline in permits may signal future challenges.
Lastly, we will receive the weekly updates on Initial and Continuing Jobless Claims, with the former forecasted for a decrease to 240k from 258k, along with the NY 1-Year Inflation Expectations for September.